The GraphSearch Admin Dashboard
26/01/2026
This section briefly describes the menu elements of the GraphSearch Admin Dashboard.
The GraphSearch Admin Dashboard is displayed after you have logged in to the installed GraphSearch instance and have the required permissions to access it.
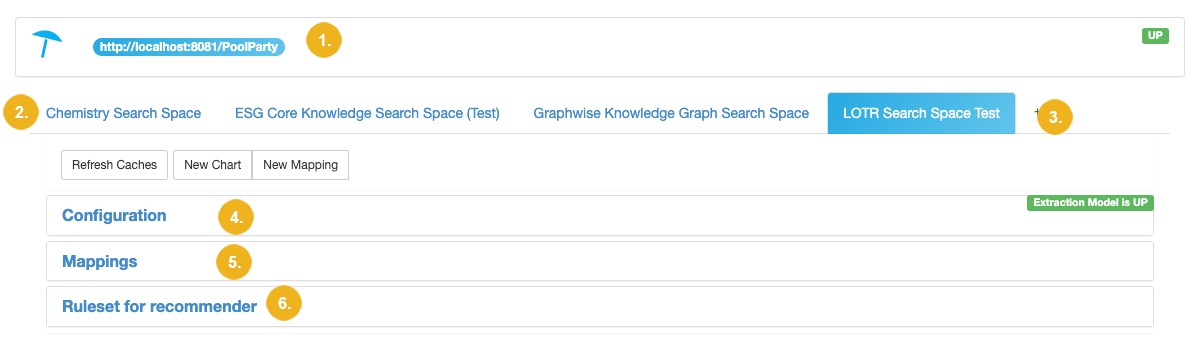
Initially you will see the following screen
Description | ||
|---|---|---|
1 | Server details | You see here the Graph Modeling server instance you are connected to and information whether this connection is active or not. The green UP icon indicates an active connection. |
2 | Tabs with available seach spaces | Each configured search space is represented as an individual tab. |
3 | The '+' icon | Click the + icon to add a new search space. |
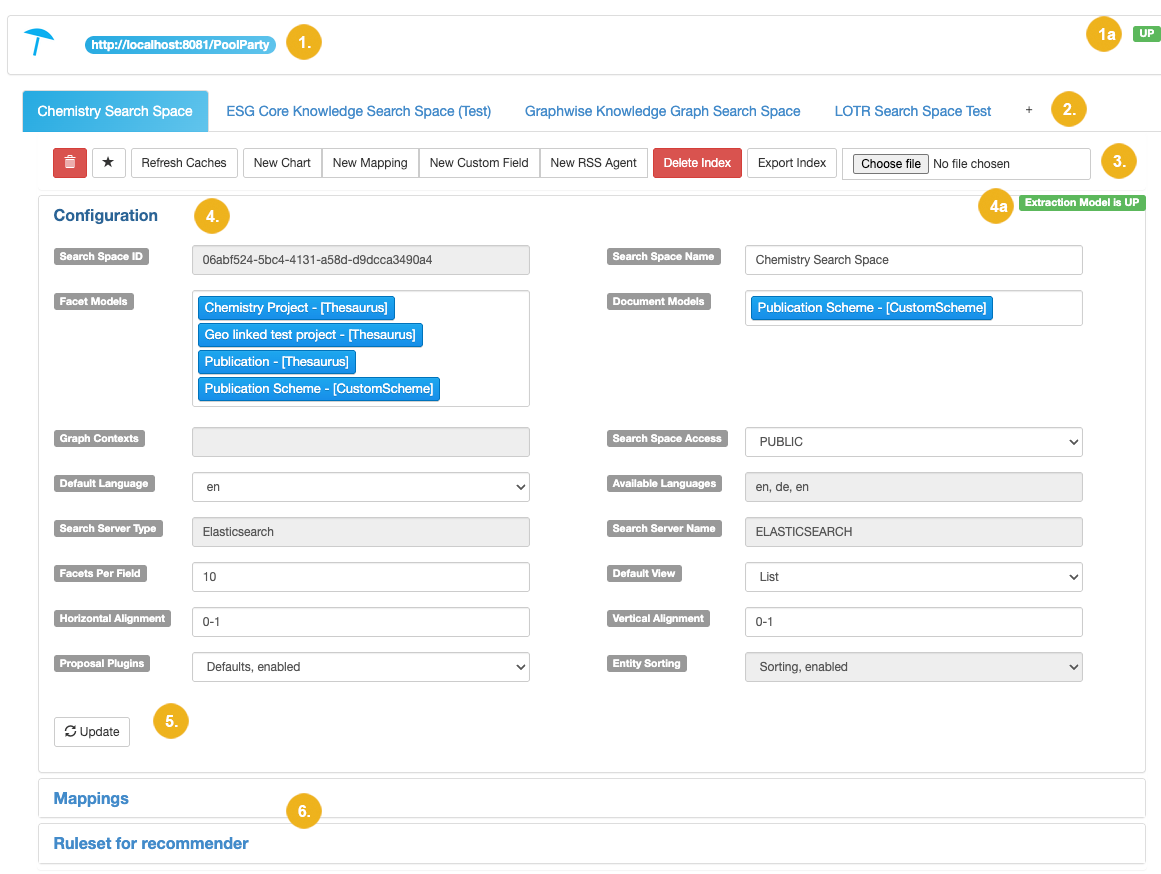
4 | The Configuration section | Click Configuration to open the corresponding section and view or modify the search space configuration details. Click it again to close this section. If you have just added a new search space this is where you specify all its settings. |
5 | The Mappings section | Click Mappings to view, add respectively edit or delete any existing mappings. Click it again to close this section. |
6 | The Ruleset for recommender section | These settings have been deprecated and are no longer supported. |
Important
Due to moving the GraphSearch frontend to the Application Development Framework (ADF) some of the settings have been deprecated and cannot be configured here. Such settings are indicated by using italics.
Note
Depending on the configuration settings of the selected tab you will see a row of menu items relating to any actions perfomable for the selected search space. This list is above the three sections Configuration, Mappings and Ruleset for recommender and may vary reflecting the actual search space configuration.
The subsequent paragraphs provide more details on two sections: Configuration, Mappings . Note that Ruleset for recommender is no longer supported.
Tip
The sections can be opened or collapsed with a click on their names.
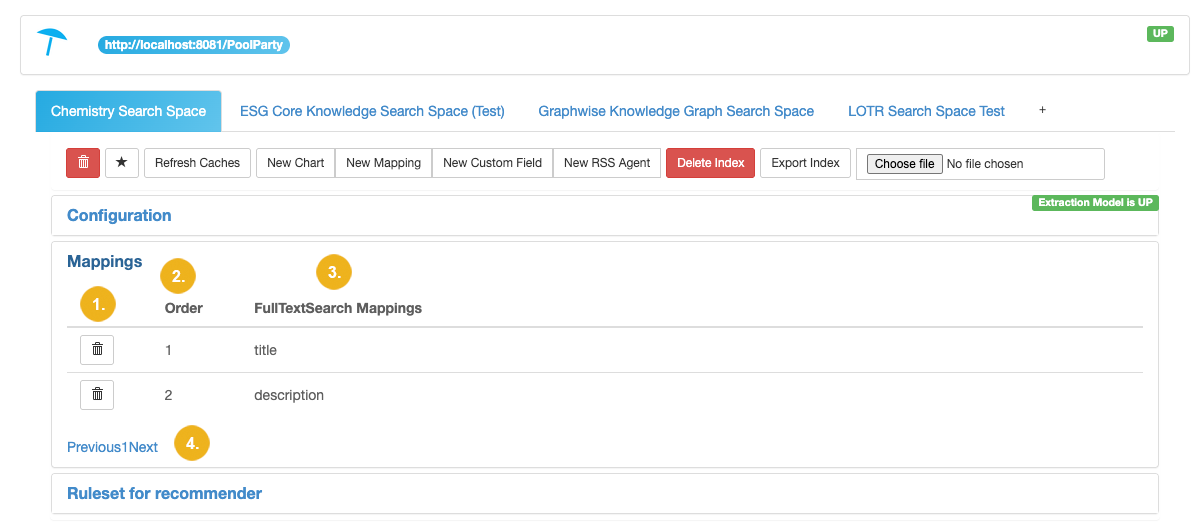
The Mappings section lists all mappings defined for the selected search space. These mappings are set for a full-text search based on the specified index field.
Note
* The name of the third column depends on the selectable mappings - it can be for instance Title Mappings, Facet Mappings, Description Mappings, FullTextSearch Mappings, or Image Mappings. When using Elasticsearch only FullTextSearch Mappings are available.
When creating a new mapping you can select one of them provided they are available for the selected searchspace in the respective pulldown.
Tip
The only available mapping type for Elasticsearch is FullTextSearch Mappings.